
With 2022 concluded, we’re taking a look back at how the USPTO performed in terms of its throughput, and examination trends in the types of refusals it has issued over time.
I. Trademark Office Examination — Volume and Throughput
Let’s look at sheer volume — how is the USPTO keeping up? Not well! Per the USPTO’s own data in the Trademarks Data Q1 2023 snapshot, first actions are taking in excess of 8.4 months and total pendency has exceeded 14.3 months.
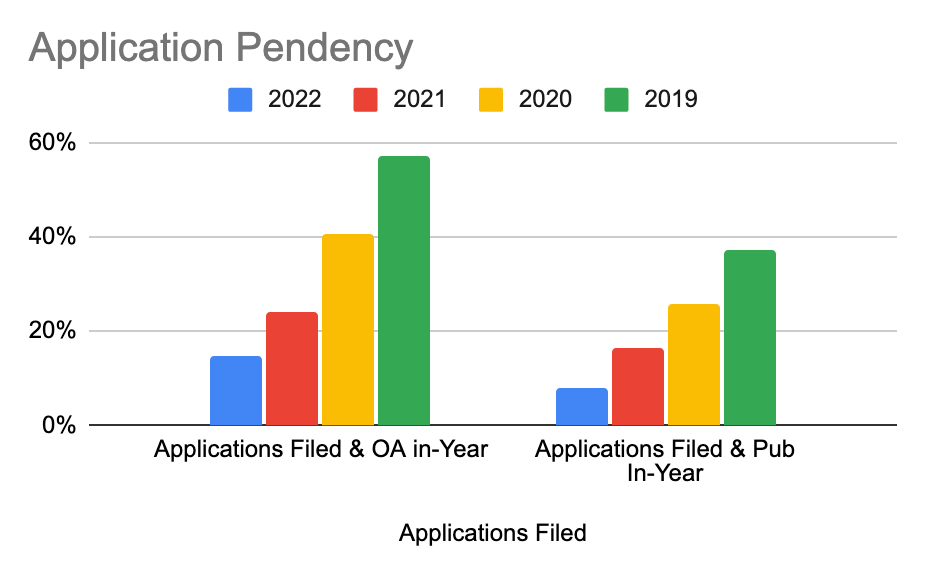
We took a slightly different approach to see how the Office is coping — two approaches, in fact. Overall, application volume was down — in 2020 and 2021, applications exceeded 660,000; in 2022, those dropped a bit to just shy of 550,000. Filing rates remain above the 500,000 filings from 2019. A slowing economy and inflation probably contributed to the drop.
Despite this, the Office is slipping further and further behind. Rates for two indicators of “quick examination” both plummeted — applications that were (a) both filed and given an Office Action in the same calendar year and (b) both filed and published in the same calendar year. Very, very few applications were dealt with quickly in 2022.
II. Refusal Breakdown – What is Blocking Applications in 2022?
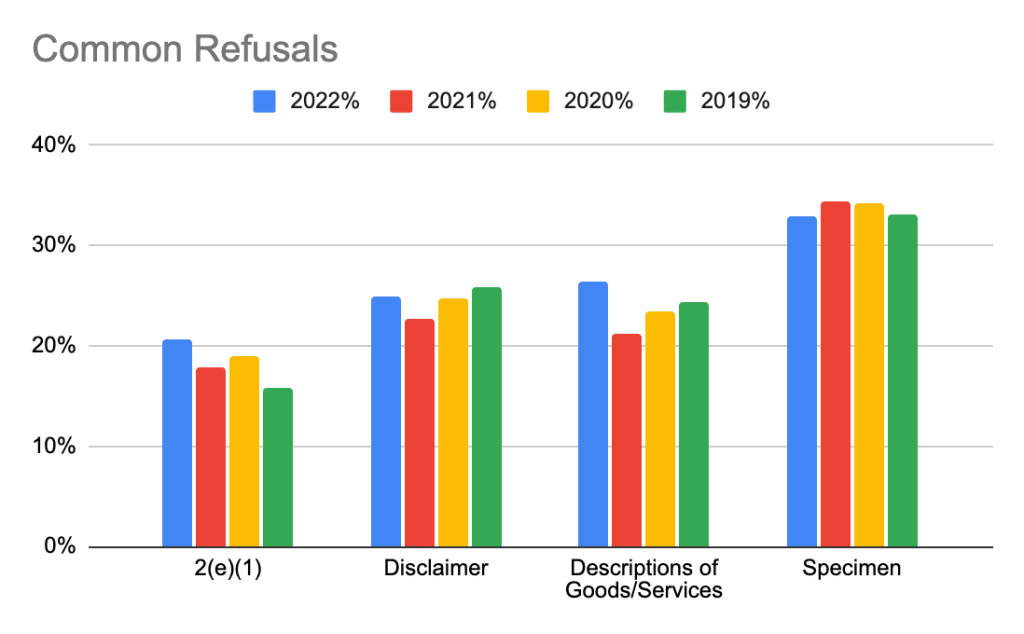
We also took a look at what sorts of issues applications were running into over the same 2019-2022 time frame. First, we examined the most common refusals: likelihood of confusion refusals, descriptiveness/disclaimer requests, description of goods and services changes, and specimen refusals. Each of those issues impact an average of 15%+ of applications examined each calendar year. Acquired distinctiveness-related refusals account for around 6% annually, and messed up the scale of either chart, so it’s been left off entirely.
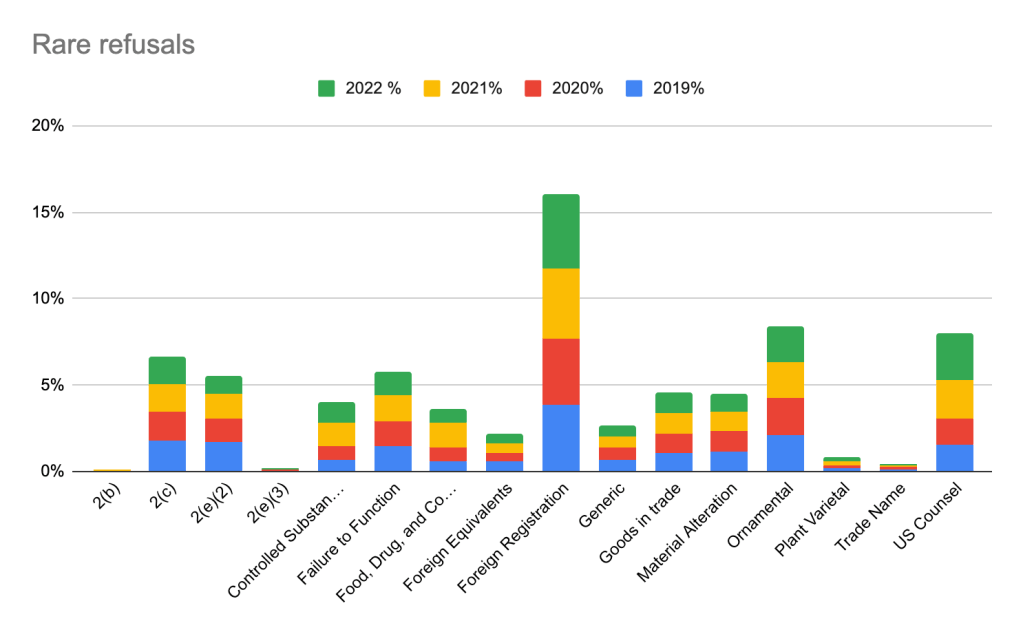
All of the rest of refusals together are a comparative pittance. Some of these refusals are highly clustered — the weed-related CSA and FDA refusals in the cosmetic/pharma/edible classes, ornamental refusals in clothing, etc., and almost never occur outside of those core classes. Others, like suspensions while waiting for foreign registrations to issue, are as evenly dispersed as applications generally.
IV. A Detailed Look at 2(d) Refusals
Between 50% and 60% of 2(d) refusals each year cite to a single prior filing as the cause of the refusal, with about 20-25% each of 2 or 3+ citations. In 2022, more than 40% of the refusals predicated on a single mark had a direct class overlap. Between these, it suggests that a large number of 2(d) refusals are pretty straightforward.
IV. Doing Better – How the Office Can Change
What can the Office do to help reduce its work backlog? Better tools on the front end of the application process might go a long way in ensuring that the Office has less that it needs to examine.
Automated screening of descriptions of goods and services to show applicants (particularly those self-filed or less familiar with the Office process) where the IDs are likely falling short of the acceptable standards would go a long way to addressing an extremely common cause for refusals. Similarly, automatically suggesting disclaimers for terms that are very often disclaimed for the filed-for goods could avoid a lot of the Office Actions around that issue. Finally, some basic screening of identical-mark / identical-class filings would remove a lot of “low-hanging fruit” from getting 2(d) refusals by pushing those applicants to an alternative mark that isn’t immediately and obviously non-viable.
We don’t especially expect any of this to happen, and we are not seeing many promising signs that the Office is likely to catch back up and return to the 3-4 month examination window that most trademark professionals had grown accustomed to.
